

Macro investors face a structural problem with traditional economic data: it is backward-looking, low-frequency, and heavily revised. GDP figures are released quarterly and revised multiple times. PMI surveys are monthly. Even high-frequency indicators like weekly jobless claims or credit card spending data represent a narrow slice of economic activity.
Alternative data offers something different for macro analysis: a continuous, real-time view of aggregate economic activity derived from billions of digital signals, spanning geographies, sectors, and consumer behaviors. When aggregated into a diffusion index format — tracking how broadly demand signals are rising or falling across a universe — the result is a leading indicator of economic conditions that complements or often precedes the traditional macro data releases.
What a diffusion index measures
A diffusion index is a summary measure of breadth. Instead of asking "is the average signal rising?" it asks "how many signals are rising?" A reading above 50 means more than half of the tracked series are moving in the indicated direction; below 50 means the opposite. The index format removes the distortion of a few outliers dominating the average and captures whether conditions are broadly improving or broadly deteriorating.
In economics, this format is familiar from PMI surveys. The same logic applies to digital behavioral data. If 65 out of 100 tracked demand signals — across search, e-commerce, social, and app usage — are trending upward in a given geography, that is a meaningfully different macroeconomic environment from one where only 38 out of 100 signals are rising, regardless of whether any individual signal is at an absolute high or low.
The diffusion format also handles the normalization problem. Different data sources (Google Search, Amazon, Wikipedia, TikTok) have different absolute scales and seasonal patterns. Reducing each to a direction (rising/flat/falling) and aggregating the breadth removes the need to compare apples and oranges at the level of individual series.
Why digital demand signals are useful for macro analysis
Traditional macro indicators measure activity after it has happened. Consumer spending data reflects purchases that have already occurred. Survey-based indicators like the Consumer Confidence Index reflect what people say they expect, which is not always what they do.
Digital demand signals are different in a few important ways:
They are leading. People search before they buy. They watch product videos before they purchase. App download trends precede active usage. The chain from digital intent to real-world economic activity has a consistent lead time — typically weeks to months for consumer behavior, longer for capital expenditure categories.
They are continuous. Unlike monthly surveys or quarterly reports, digital signal data updates daily or in real time. This means you can detect a change in macro conditions within days of it starting, not weeks or months later when official data catches up.
They are global. A macro diffusion index built on search data from 40+ countries can tell you something about the relative pace of demand recovery across geographies — before it is visible in PMI releases, trade data, or corporate guidance.
They capture consumer behavior directly. Rather than asking people what they expect to spend (survey-based) or measuring what they spent last month (transaction-based with a lag), digital signals capture intent and engagement in real time.
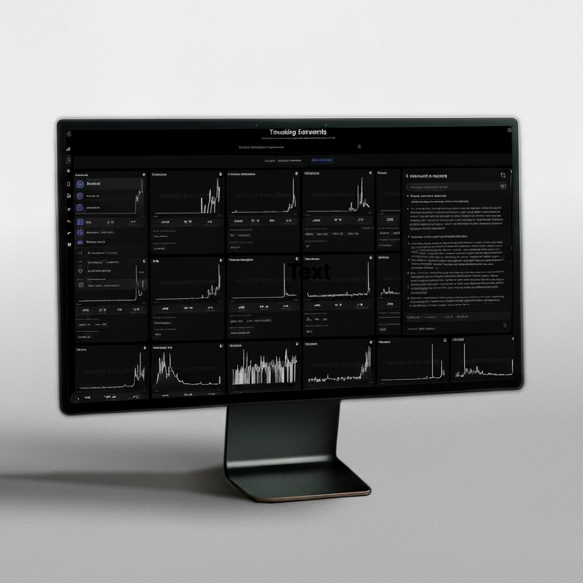
How the Paradox Global Macro dashboard works
The Global Macro tool in the Paradox Intelligence platform aggregates demand signals from 20+ alternative data sources across geographies and sectors into a diffusion index format, updated continuously.
The dashboard shows:
- Aggregate diffusion by geography: Which countries or regions are showing broadly improving or broadly deteriorating digital demand signals. This is useful for relative value analysis (e.g. which DM or EM markets are inflecting) and for cross-currency or rate positioning.
- Sector-level diffusion: Which sectors (consumer discretionary, technology, industrials, healthcare, etc.) are showing rising breadth of signals, and at what speed. Sector diffusion can lead sector rotation in equities by weeks to months.
- Source composition: Whether rising breadth is driven primarily by search, social, e-commerce, or news signals, and whether the source mix is consistent with a genuine demand trend versus a media-driven narrative.
- Historical context: How current diffusion readings compare to the same point in prior cycles, providing a framework for understanding whether conditions are early-cycle, mid-cycle, or showing signs of topping or bottoming.
The output is designed for macro-oriented investors and asset allocators who want a continuous, leading-indicator view of global economic conditions without waiting for official data releases.
Practical applications for macro investors
Identifying economic turning points. Diffusion-based readings from digital data have historically turned ahead of official economic data. Monitoring the breadth of demand signals across geographies can provide early warning of both growth acceleration and deceleration — a tool for timing macro positioning before it is obvious in reported figures.
Cross-country relative value. If digital demand signals are broadly rising in Germany but broadly falling in China over the same period, that divergence can inform currency, rate, or equity index positioning — ahead of official data confirming the divergence.
Sector rotation timing. Sector-level diffusion readings can help time transitions between growth-sensitive and defensive sectors. When technology and consumer discretionary diffusion is rising while healthcare and utilities is flat, that configuration has historically been consistent with early-to-mid-cycle equity market dynamics.
Validation of central bank policy signals. Central banks increasingly reference "big data" and "alternative data" in their own research and policy communications. Diffusion indexes from digital data can serve as an independent check on whether the conditions that central banks are describing in speeches and minutes are actually visible in the digital economy.
Recession monitoring. Sustained deterioration in broad diffusion — where more than half of tracked demand signals are declining across multiple geographies simultaneously — is a more reliable recession signal than any single indicator, because it requires both breadth and duration rather than a single negative data point.
Limitations and how to manage them
Digital signals are biased toward digitally active populations. A global digital diffusion index over-represents younger, urban, internet-connected consumers and under-represents older, rural, or less digitally connected segments. This matters more for some geographies and some sectors than others.
Short-term noise is higher at the source level. Individual search or social signals can spike due to one-off events. The diffusion format mitigates this at the index level, but individual components should still be interpreted with awareness of their noise profiles.
The index measures breadth, not magnitude. A diffusion reading of 65 tells you that 65% of signals are rising, but not by how much. Combining diffusion with level-based analysis (e.g. average signal value or rate of change) provides a more complete picture.
For more on global macro and alternative data, see Datasets and Research.
- Find Your Plan
This post is for institutional investors and research professionals. It is not investment advice.