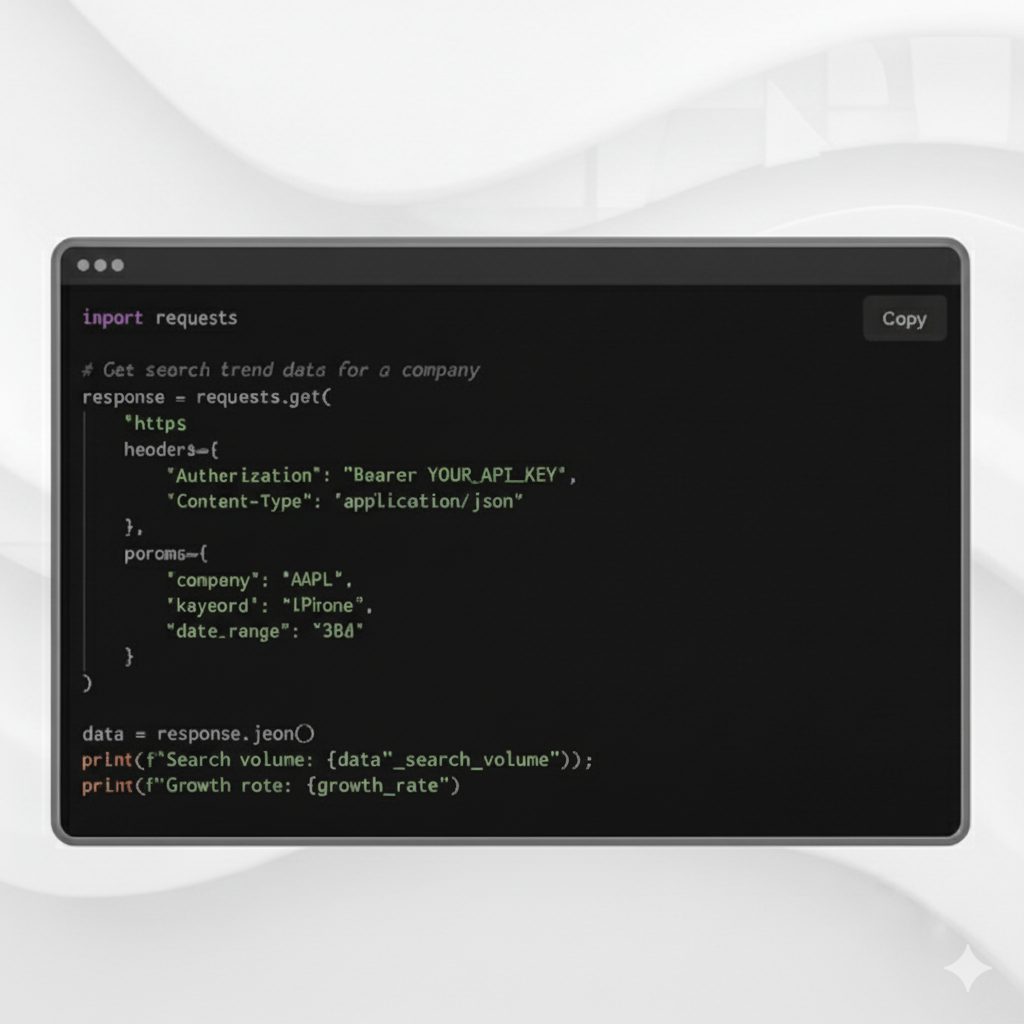
One of the structural limitations of traditional investment research is that it is sequential. An analyst covers a set of names, checks their data on a schedule, and updates their view periodically. The world, however, is not sequential. Digital signals — search trends, social engagement, news sentiment, app usage — move continuously and often across multiple markets at once. What you miss in the gap between your last check and your next one can be significant.
Global intelligence network visualization is a different approach: instead of pulling data on demand, it shows you the current state of signal flows across your entire coverage universe in real time, so you can see where things are moving before you know to look.
What a global intelligence network shows
The concept comes from systems monitoring and network analysis, applied to financial signals. Instead of a table of numbers or a chart for one company, a global intelligence network visualization presents:
- The current state of signals across all tracked instruments and data sources — which are rising, which are falling, which are flat.
- The geography or topology of signal activity — where in the world search or social activity is concentrated for a given theme or company.
- The intensity and direction of movement — not just whether something is happening, but how fast and in which direction.
- Cross-source comparison at scale — how different data types (search vs. social vs. news) are behaving simultaneously across the same universe.
The value is not in any one data point but in the pattern across many. When you can see that five companies in a sector are all showing simultaneous upward movement in search and sentiment while the rest of the sector is flat, that pattern is immediately visible. It would take hours to assemble the same picture by querying each company individually.
Why real-time matters
Alternative data has always had a timeliness advantage over reported financials, but "timeliness" means different things at different speeds. A weekly update is timely relative to a quarterly earnings report. A daily update is timely relative to a weekly one. Real-time is timely relative to an event that is happening right now.
The use cases for real-time alternative data are different from those for weekly or daily data:
Event monitoring. If a company is mentioned in a major news story, a product goes viral on social media, or a regulatory announcement hits, real-time signals can reflect the demand or sentiment impact within hours, not days. Investors who can see and act on that quickly have an advantage over those waiting for end-of-day or end-of-week summaries.
Cross-market arbitrage. Demand signals sometimes appear in one geography before they appear in another. A consumer trend gaining traction in search data in Europe may take weeks to cross over to the US, or vice versa. Real-time global visibility can surface these leads before they are priced into internationally listed names.
Pre-market and intraday setup. For event-driven or tactical strategies, real-time data in the hours before market open can inform positioning based on overnight signal developments across news, social, and search.
How the Paradox Nervous System works
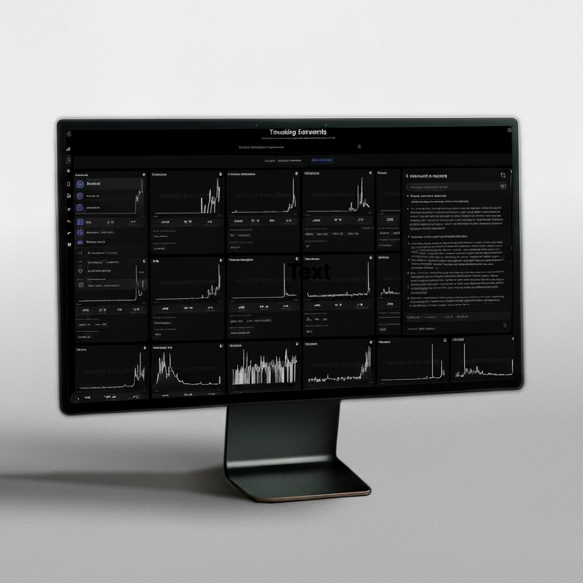
The Paradox Nervous System is a real-time global intelligence network visualization built around the Paradox Intelligence dataset. It maps live data flows from 20+ alternative data sources — Google Search, TikTok, Reddit, News, Amazon, YouTube, Wikipedia, Web Traffic, App Downloads, and others — across 50,000+ tracked instruments in a single, continuously updated visual.
The visualization is designed around pattern recognition rather than data retrieval. Rather than asking "what is the trend for company X?" you can see, at a glance, which parts of the signal universe are active, which themes or instruments are producing the most movement, and whether that movement is concentrated or broad.
Key features include:
- Live signal intensity mapping across all data sources and all tracked instruments simultaneously.
- Geographic signal distribution showing where in the world activity is concentrated.
- Source-level breakdowns so you can see whether a movement is driven by search, social, news, or a combination.
- Drill-down to individual instruments when a pattern in the global view warrants closer inspection.
The system is designed for investors who need to monitor a large universe without the cognitive overhead of checking each name manually.
Use cases in practice
Morning intelligence briefing. Use the global view at the start of the day to identify which names or themes had meaningful overnight signal movement. This replaces the manual process of checking each name in a watchlist and gives you a prioritized list of what to investigate further.
Sector surveillance. Maintain a continuous view of signal activity within a sector or theme. When activity concentrates in a cluster of names simultaneously, that is a prompt for thematic research — whether a sector rotation, a shared catalyst, or a competitive shift.
Event response. After a major macro event (central bank decision, geopolitical development, major earnings surprise), use the global view to see which parts of the alternative data universe are reacting and in which direction. This can help identify which names are exposed to the event before consensus has fully processed it.
Cross-asset monitoring. For multi-asset or macro strategies, the global view can surface themes that cut across equities, currencies, and commodities — for example, commodity demand signals in search and trade data that are consistent with or inconsistent with forward curve pricing.
The limits of real-time monitoring
Real-time data creates the risk of over-trading or over-reacting to short-term noise. A few guardrails help:
Set signal-strength thresholds. Not every real-time movement warrants action. Define what counts as a meaningful deviation from baseline (e.g. a two-standard-deviation move in a rolling window) rather than reacting to every tick.
Pair real-time with context. Real-time signals are most useful when interpreted in the context of existing fundamental views and multi-week signal history. A spike in search for a company is more interesting if the underlying trend has been building for weeks than if it comes from nowhere.
Use it for prioritization, not conclusions. Global intelligence monitoring is a tool for deciding what to look at, not a tool for deciding what to do. The signal tells you where to direct research; the research tells you whether to act.
For more on signal monitoring and live data, see the Live Feed and Datasets. For long-form research and methodology, see Research.
- Find Your Plan
This post is for institutional investors and research professionals. It is not investment advice.