
Of all the cross-platform relationships in social arbitrage, the dynamic between TikTok signals and Google Search data is the most structurally interesting for consumer-focused investors. The two platforms are not substitutes. They measure different things, at different stages of the consumer journey, for different demographic cohorts. The gap between what they each show about the same brand or product is often more informative than either signal alone.
What each platform actually measures
Google Search captures intent at scale. When someone types a brand name or product category into Google, they are expressing active interest or purchase consideration. Search volume is broad: it reflects curiosity, research, comparison shopping, and navigation to a site. It tends to skew toward purchases with some consideration time, and it captures a wide age range.
TikTok captures cultural resonance. Hashtag volume and engagement on TikTok reflects how frequently a brand, product, or theme is showing up in content creation, sharing, and discovery. It tends to skew young, particularly Gen Z and younger millennials. TikTok signals often reflect virality, trend adoption, and the phase of the consumer journey where discovery happens rather than where purchase decisions are finalized.
The key structural point: TikTok is earlier in the awareness funnel than Google Search for many consumer purchases. A product goes viral on TikTok, then people who encountered it go to Google to research and eventually buy. The timing between the TikTok spike and the Google search response can be measured, and that lag is part of what makes the combination investable.
The four relationship patterns and what they mean
1. TikTok surging, search flat. The brand or product is generating TikTok content but not yet translating into purchase-intent searches. Could be an early-stage signal of building awareness, or it could be content-driven noise that will not convert. The test is whether search starts to move in the weeks that follow. If it does, the TikTok signal was leading. If it does not, the TikTok activity was viral without business substance.
2. TikTok surging, search also surging. Multi-platform confirmation of a real consumer demand wave. The brand has broken through from social discovery to active purchase intent. This is the highest-quality consumer demand signal combination. For a company with upcoming earnings, this convergence is a meaningful indicator that revenue figures will reflect the trend.
3. Search surging, TikTok flat. Purchase intent is rising among older or more mainstream consumer cohorts while the brand has not yet achieved viral social traction. Common for brands that are growing via traditional channels (search advertising, mainstream media) but have not yet captured Gen Z mindshare. Can indicate sustainable growth that does not depend on viral social dynamics, or it can indicate a brand that is aging relative to its category.
4. Both declining. Demand is weakening across both younger and broader consumer audiences. When TikTok and search divergence is negative in the same direction, the signal on brand or category deterioration is strong.
The timing dimension: leading, lagging, concurrent
One of the most useful empirical exercises with TikTok and search data is measuring the typical lead-lag relationship for a given brand or category. Some patterns that tend to appear:
TikTok leads search by 2-8 weeks for trendy consumer categories. For beauty products, fashion items, food trends, and lifestyle goods, TikTok discovery precedes Google research. A TikTok hashtag surge can be a 4-6 week leading indicator of search volume growth for the same brand.
Search and TikTok move concurrently for established brands. For household brands with broad demographic appeal, the two signals tend to move together rather than one clearly leading the other. Both are reacting to the same underlying demand dynamics.
Search leads TikTok for B2B and financial products. Categories where TikTok has limited relevance will show strong search signals with no TikTok response, by design. The absence of TikTok correlation is not a negative signal in these categories.
Understanding the timing relationship for the specific names you follow is work that pays off: it lets you calibrate how early TikTok signals are telling you something and how to weight them against search data.
Practical use cases
Identifying the next consumer breakout. Track whether mid-size or emerging consumer brands are accumulating TikTok hashtag volume before search has responded. Historical analysis can tell you how often and how quickly a TikTok surge for comparable brands in the same category has preceded search growth and eventual revenue acceleration.
Validating a thesis before earnings. Before an earnings report for a consumer brand, check whether the TikTok-search relationship is in confirmation mode (both growing, consistent with a positive quarter) or divergence mode (one growing while the other is not). The multi-signal read is more informative than either alone.
Flagging demand deceleration early. If TikTok engagement for a brand has peaked and search is still strong, you may be at the transition point where awareness is high but cultural resonance is fading. This often precedes the eventual search decline by weeks or a quarter, depending on the category.
Thematic basket construction. For investors building consumer theme baskets (e.g. beauty tech, wellness, sustainable fashion), screening by which brands show correlated TikTok and search growth within a theme can help identify the category winners vs. those who are benefiting from category tailwinds but losing brand share within it.
The demographic layer
TikTok-search divergence also has a demographic interpretation. TikTok predominantly captures Gen Z behavior. Google Search captures a broader demographic profile. When TikTok is strong and search is weak, the brand has strong Gen Z traction but limited mainstream penetration. Whether that is good or bad depends entirely on the business model:
- For a brand that is deliberately targeting Gen Z, strong TikTok with lagging search is an early stage signal, consistent with the business being early in its life cycle.
- For a brand that depends on broader demographic appeal and is losing Gen Z, the same pattern is a warning: cultural relevance is declining among the next generation of consumers even while current cohorts are still purchasing.
The same data point carries opposite investment implications depending on what you know about the business and its trajectory. That is why social arbitrage is a research discipline, not a mechanical signal.
Building the analysis
To use TikTok-search divergence systematically, you need:
- Historical TikTok hashtag volume at the brand or category level, normalized and tracked consistently over time. Not just trending real-time, but the same methodology going back months and years.
- Historical Google Search volume for the same brands and categories, comparable in granularity and normalization.
- Entity mapping that reliably connects TikTok hashtags and search terms to specific companies, not just generic category terms.
- Lead-lag analytics that can calculate the typical timing relationship between the two signals for your coverage universe.
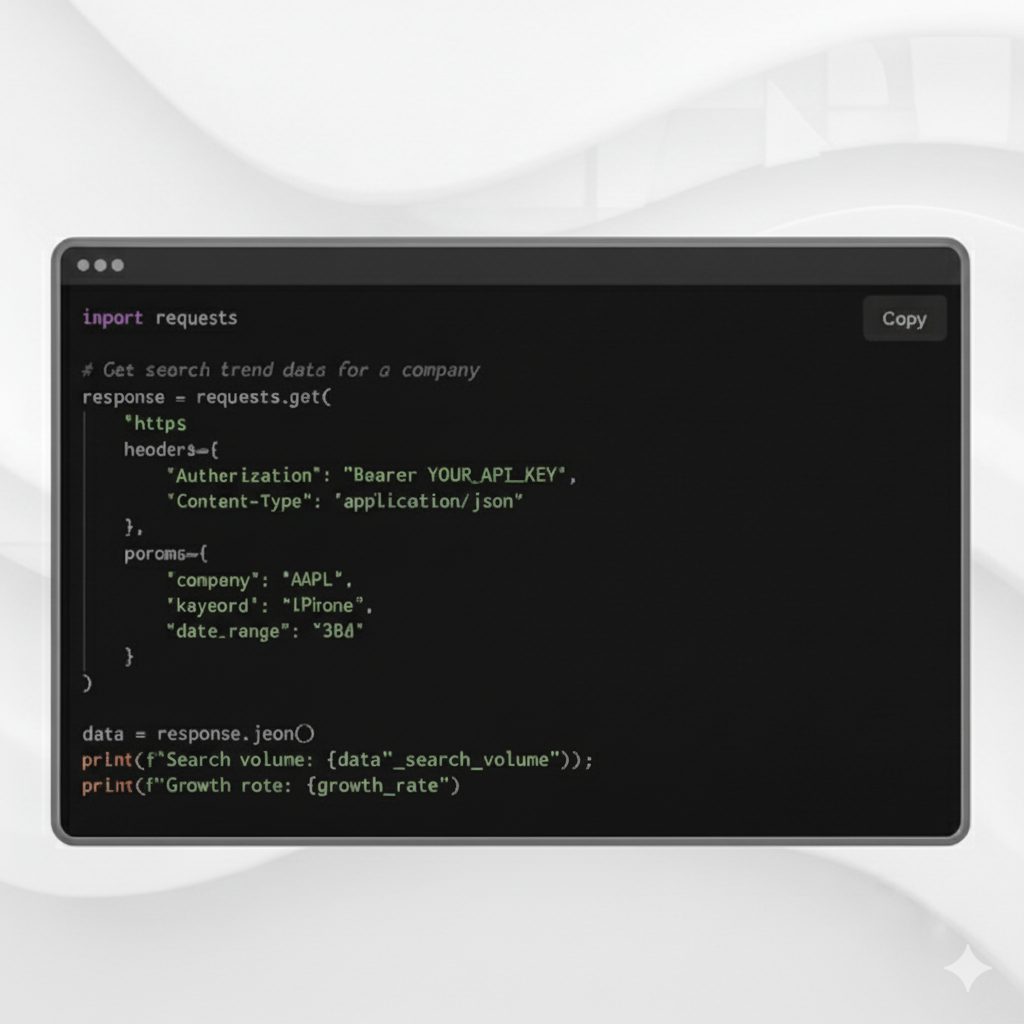
Platforms designed for institutional alternative data research, like Paradox Intelligence, provide exactly this: normalized, historically consistent TikTok and search data alongside other behavioral sources, mapped to companies and themes, with the tools to analyze signal relationships.
Bottom line
TikTok and Google Search are complementary, not redundant. The relationship between them, whether they confirm, diverge, or one leads the other, is some of the most actionable information available for consumer investors. The TikTok-leads-search pattern is a structural feature of how many consumer demand waves propagate. Investors who measure and use this relationship systematically are doing social arbitrage in its most practical form: reading information that exists in the data before it shows up in reported results.
For context on how TikTok data is used more broadly, see TikTok Hashtag Data for Investment Research and Cross-Platform Divergence: The Core Signal in Social Arbitrage.
Explore the data
- TikTok Trends dataset
- Google Search Trends dataset
- X / Twitter Analytics dataset
- Alternative Data Catalog
- Find Your Plan
This post is for institutional investors and research professionals. It is not investment advice.