
Thematic investing has become more common across institutional strategies — from sector rotation to long-term structural themes. But identifying which themes are genuinely gaining momentum versus which are just well-covered narratives is harder than it looks. By the time a theme is on the cover of a financial magazine, the edge is often gone.
Alternative data offers a different approach: instead of tracking analyst coverage or fund flows, you track the digital signal intensity of a theme directly — how search, social, news, and behavioral data around it are moving in aggregate. When multiple signals for a theme are accelerating simultaneously, it often precedes the point at which institutional capital begins to rotate in meaningfully.
What makes a catalyst thematic
A thematic catalyst is distinct from a company-specific catalyst. A company catalyst is something that affects one name: an earnings surprise, a product launch, a management change. A thematic catalyst is something that affects a category, sector, or structural trend: a technology cost inflection, a regulatory shift, a demographic change, a commodity shock, a consumer behavior transition.
The key property of a thematic catalyst is that it creates winners and losers across multiple companies, often before it is obvious which companies are most exposed. This is where alternative data can add disproportionate value: it is often easier to see a theme inflecting in the data before you know exactly which stocks to own.
A few examples of what thematic catalysts look like in alternative data:
- AI infrastructure demand: search volume for data center components, GPU availability, and cloud capacity rising across multiple platforms simultaneously, well before semiconductor names show it in earnings.
- Consumer trade-down: Amazon search for private-label or value brands accelerating while premium brand search decelerates, as a leading indicator of margin and mix pressure for consumer goods names.
- GLP-1 drug adoption: Wikipedia page views and Google Search for GLP-1 medications growing steeply before the scale of the market opportunity was reflected in consensus estimates for pharmaceutical companies.
- Electric vehicle demand shifts: TikTok and YouTube engagement around specific EV models as a leading indicator of order flow and waitlist dynamics months before delivery numbers were reported.
In each case, the signal was visible in behavioral data well before it reached consensus or was confirmed in financials.
How to track thematic signals systematically
The challenge with thematic analysis is that themes are fuzzy. Unlike a company, a theme does not have a ticker. You have to define what you are measuring, and that definition shapes what you find.
A practical approach:
Define the theme with a signal set. For each theme you track, identify the keywords, brands, products, and companies that best represent it across different data sources. For a theme like "AI productivity tools," that might include specific product names on YouTube and TikTok, category searches on Amazon and Google, and company names in news sentiment.
Track intensity and direction together. Intensity tells you how large the signal is; direction tells you whether it is growing or shrinking. A theme with high intensity but flat or declining direction is mature or peaking. A theme with lower absolute intensity but steeply accelerating direction is early.
Look for cross-source confirmation. As with company-level analysis, a theme showing momentum in one data source is weaker than one showing momentum across search, social, news, and behavioral data simultaneously. Cross-source confirmation reduces the probability that you are seeing a media-driven spike rather than a genuine demand or adoption shift.
Set a review cadence. Themes evolve on different timescales. Some thematic catalysts play out in weeks (a regulatory announcement); others develop over quarters or years (a demographic shift). Match your monitoring cadence to the speed of the theme.
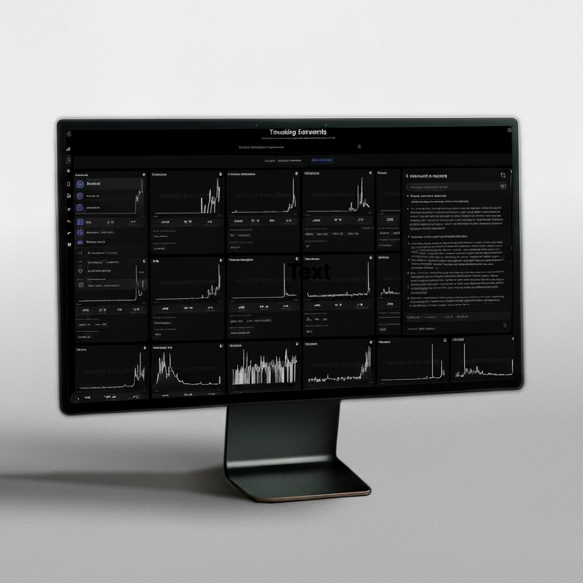
Thematic Catalysts in the Paradox Intelligence platform
The Thematic Catalysts tool in the Paradox Intelligence platform is designed around this methodology. It surfaces structural market shifts by category with signal intensity indicators and heatmaps, updated in real time across 20+ data sources.
Key capabilities:
- Intensity heatmaps that show, for each theme, how many data sources are confirming upward or downward momentum and at what magnitude.
- Category and sector breakdowns so you can see which themes are active within a sector versus cutting across sectors.
- Historical signal context showing how current intensity compares to the same theme's history, which helps distinguish a genuine inflection from a mean reversion.
- Company mapping so you can move directly from a theme showing momentum to the companies most exposed to that theme within the Paradox universe.
The output is designed to support the early stages of thematic research: identifying which themes are worth deeper investigation, not replacing the fundamental work that follows.
Applying thematic signals in portfolio construction
Once a theme is identified as gaining momentum in alternative data, the next question is how to translate it into a portfolio view. A few considerations:
Identify the most exposed names. For a theme inflecting positively, which companies have the highest revenue or margin exposure? Which are at an early stage of benefiting versus those already pricing in the theme? Sorting the universe by alternative data momentum alongside fundamental screens can help narrow the list.
Assess the crowding risk. If a theme is visible in alternative data, other systematic investors may be seeing it too. Look at positioning data, valuations, and how broadly the theme is already discussed in sell-side research. A theme that is highly crowded but showing peak signal in the data is a different opportunity from one that is still early with low positioning.
Use the data as a catalyst tracker, not a valuation tool. Alternative data is good at indicating when something is happening — demand is shifting, adoption is accelerating, narrative is turning. It is not a valuation tool. Combine thematic signals with your normal valuation framework rather than treating signal strength as a proxy for expected return.
Set exits in advance. Thematic trades require clear exit logic because the signal that validates the entry (momentum in the data) can also signal the exit (deceleration or reversal in the data). Define what a change in signal would mean for your thesis before you put the trade on.
For more on thematic research methodology, see Alternative Data Inflection Points and Research.
This post is for institutional investors and research professionals. It is not investment advice.