


Alternative data has moved from discretionary research tool to quantitative input. Quant teams at hedge funds, asset managers, and family offices are building factors from search trends, sentiment series, social engagement data, and web behavior alongside the traditional price, volume, and fundamental datasets they have always used. This post covers how that works in practice.
Why behavioral data works as a quant signal
The premise behind using digital behavioral signals in systematic strategies is straightforward: consumer and investor behavior shows up in digital platforms before it shows up in prices or earnings. When search volume for a product rises, demand intent is rising. When news sentiment shifts negative on a company, the narrative is changing. When TikTok engagement around a brand spikes, it is picking up cultural momentum that may translate into commercial performance.
These behavioral shifts are: - Observable before the fact. Unlike earnings, which are reported after the quarter closes, search and social signals are available in near real time. - Continuous and updatable. Unlike fundamental data that arrives on a quarterly schedule, digital signals update daily or weekly, allowing systematic strategies to run continuous factor exposures. - Largely independent from price and fundamental signals, providing diversification value in a multi-factor model.
Research on search-based signals consistently finds predictive power in the 1-4 week horizon, with some studies documenting return predictability and informational efficiency improvements when combined with price momentum.
Signal types and their quant applications
Google Search demand. The normalized volume of searches related to a company's products or brand name. Used as a demand proxy, particularly for consumer-facing companies. Higher search volume relative to peers or to the same company's historical baseline is a bullish demand signal.
Google Shopping demand. Searches with explicit purchase intent on Google Shopping. More directly tied to near-term sales activity than general web search. Useful for retailers, consumer brands, and e-commerce names.
Amazon search volume. Product-level search demand on Amazon. Particularly relevant for brands that derive significant revenue from Amazon, where Amazon search volume is a direct leading indicator of sales.
YouTube search volume. Content interest and brand discovery on YouTube. Useful for brands with product categories that are heavily researched via video before purchase.
TikTok engagement volume. Hashtag and content engagement around a brand or product on TikTok. Captures social buzz and viral momentum, often 2-4 weeks before downstream effects on awareness and sales.
News sentiment. Normalized sentiment score derived from news volume and sentiment about a company. Used as a risk signal (spikes in negative sentiment), an event signal, or a narrative momentum factor.
Wikipedia page views. A clean, manipulation-resistant proxy for public attention. Often used alongside other signals as a confirmation of broad awareness.
From raw signal to investable factor
Step 1: Source clean, normalized data
Raw search or social data from unofficial sources is noisy, inconsistently normalized, and prone to methodology changes. Investment-grade alternative data providers normalize signals to a consistent 0-100 scale (or provide absolute volume estimates), apply consistent methodology across time, and map keywords or signals to equity tickers. This is the baseline requirement before any factor construction.
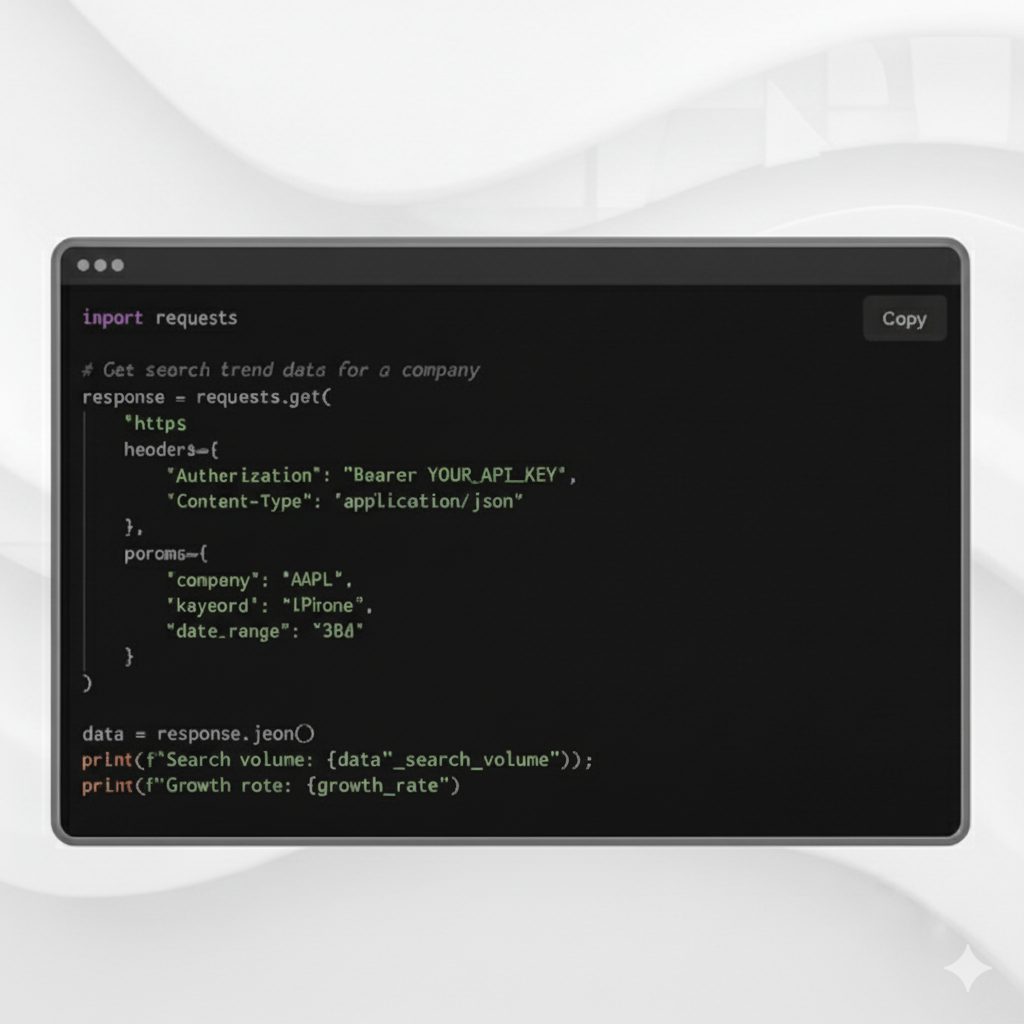
Paradox Intelligence provides normalized time series for Google Search, Google Shopping, YouTube, TikTok, Amazon, Wikipedia, news sentiment, and news volume, mapped to listed companies, accessible via REST API, desktop platform, or MCP server.
Step 2: Define the signal specification
Before backtesting, specify exactly how the signal is constructed:
- Level or change? Raw level (absolute demand) or rate of change (momentum in demand)? Most quant applications use some form of change: week-over-week, month-over-month, or a moving average crossover.
- Absolute or relative? Compare the company's signal to its own historical baseline, or to peers in the sector? Both are valid; peer-relative normalization is useful when industry-wide seasonality is a confound.
- Multi-source composite or single source? A composite of search + social + sentiment often has better signal-to-noise than any single source alone. Construct the composite before backtesting to avoid data snooping.
- Time horizon. What return window are you trying to predict? Short-term (1-4 weeks) signals use fast-moving indicators; medium-term (1-3 months) signals benefit from slower moving averages that smooth noise.
Step 3: Backtest with discipline
Standard quant hygiene applies, but a few issues are specific to alternative data:
- Look-ahead bias. Know exactly when each data point was available for use. Search data that aggregates a full week may only be reliably available a day or two after the week closes. Build your point-in-time dataset accordingly.
- Backfill bias. Some alternative data vendors have restated or revised historical data. Confirm the provider's data is point-in-time and not retrospectively adjusted.
- Universe and coverage. Alternative data often has uneven coverage across the ticker universe. Smaller names or international companies may have lower signal reliability. Constrain the backtest to names where coverage is consistent.
- Signal decay. Behavioral signals tend to have shorter useful horizons than fundamental signals. Test multiple return windows to find where the signal actually lives.
Step 4: Understand the economic intuition
A factor that works in backtest but lacks a plausible economic mechanism is fragile. Before committing to a signal, articulate why it should work: search volume for a product reflects consumer demand intent that leads reported sales by 2-6 weeks; news sentiment captures narrative shifts that correlate with analyst revision cycles. The mechanism helps you understand when the signal should break down (e.g., if a company moves to a subscription model where one-time purchases are no longer the primary revenue driver, demand search volume becomes less informative).
Step 5: Combine with existing factors
Digital behavioral signals work best as part of a multi-signal framework. Useful combinations include:
- Search demand + price momentum: Demand signal provides early-stage conviction; price momentum confirms it is being priced. Together they reduce the incidence of value traps or fading momentum.
- News sentiment + event calendar: Sentiment spikes near earnings or corporate events have stronger predictive power than baseline sentiment drift.
- Social engagement + short interest: Rising TikTok or social engagement against high short interest is an early signal of short-squeeze potential in consumer names.
- Multi-source composite + fundamental surprise: A composite of several behavioral signals, combined with an estimate revision signal, tends to outperform either alone.
Data access for systematic workflows
For quant teams, the data format matters as much as the signal. Useful access methods include:
REST API. The standard for programmatic data retrieval. Allows scheduled pulls of updated series into a data warehouse or model pipeline. Check the provider's update schedule, rate limits, and output format (JSON, CSV).
MCP server. For teams using AI coding assistants or agent frameworks (Claude, Cursor, or in-house LLM systems), an MCP server allows the model to query alternative data directly as part of a research or coding workflow. Paradox Intelligence provides an MCP server alongside its API. See MCP Servers for Alternative Data.
Bulk download. For initial backtesting and historical research, a full history dump is often more efficient than repeated API calls. Confirm the provider supports this and what the historical depth is (typically 3-5 years for alternative data).
Common pitfalls
Overfitting on short history. Most alternative data providers have 3-7 years of clean history, which is shorter than what quants prefer for robust factor testing. Be conservative about the number of parameters you fit.
Ignoring coverage gaps. A signal that covers only 60% of your universe creates an implicit sector or size bias. Document the coverage and test whether the uncovered names have different characteristics.
Using the UI instead of the API. If your quant process runs daily, a manual UI lookup is not scalable. Invest the engineering time to set up a proper data feed before relying on a signal in production.
Treating high correlation as validation. A behavioral signal that is highly correlated with price in backtest may simply be picking up price-to-search momentum, not leading it. Test the signal with sufficient lag to confirm direction of causality.
For an overview of signal types and providers, see Best Alternative Data Platforms 2026. For Paradox Intelligence's API and dataset details, see APIs and Datasets. For long-form research, see Research.
- Find Your Plan
This post is for institutional investors and research professionals. It is not investment advice.