
Most investment processes are built around scheduled information: earnings calls on a calendar, economic releases on fixed dates, analyst notes on a weekly cycle. The world does not operate on a schedule. Consumer behavior shifts in real time. News breaks at unpredictable moments. Social trends accelerate or reverse in hours. The investors who can see those shifts as they happen — rather than in the next batch of scheduled data — have a structural advantage.
Real-time alternative data feeds are the infrastructure layer for this. They surface what is moving, across which sources, and for which instruments, as it happens — not in yesterday's file or next week's report.
What "real-time" means in alternative data
The term real-time is used loosely. In practice, for alternative data, it means different things for different sources:
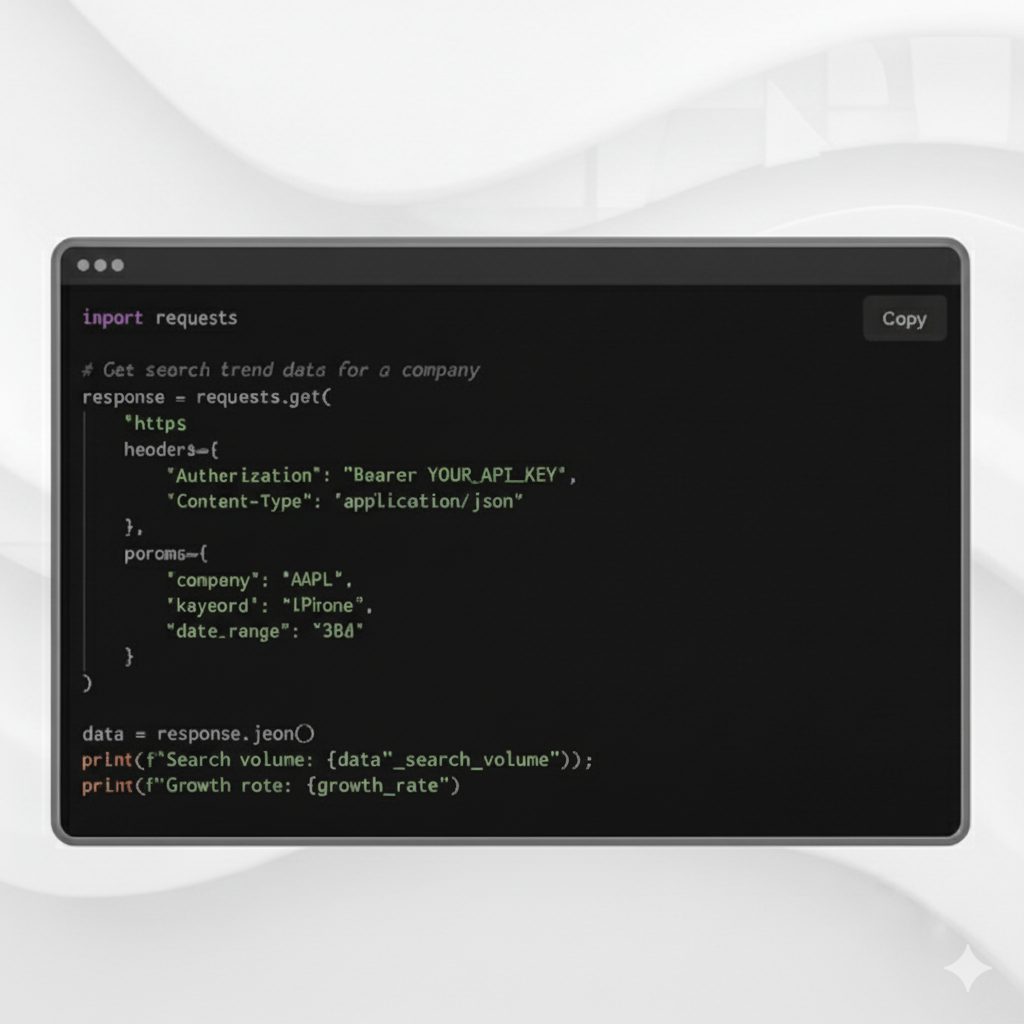
Search and intent data (Google, Amazon, YouTube) updates at sub-daily or daily granularity. Search trends reflect what people are doing with their attention hours ago, not weeks ago. For fast-moving consumer trends or event-driven signals, this is meaningfully faster than any reported financial metric.
Social and engagement data (TikTok, Reddit, X/Twitter, Instagram) can update in near real-time — hours, not days. Viral moments, brand crises, and product launches show up in social engagement data immediately and in sentiment analysis within hours.
News data is close to real-time by its nature. News sentiment and volume indexes can be calculated on a rolling basis across hundreds of sources, giving a continuous read on narrative development around any company or theme.
App and web data typically updates daily. App download estimates and web traffic trends are not instant but are materially faster than waiting for a company to report monthly active users in an earnings call.
The combination of these sources — even with their different latency profiles — creates a substantially faster information layer than anything derived from reported financials or analyst estimates.
The live feed as a surveillance tool
The core use case for a real-time alternative data feed is surveillance: monitoring a large universe simultaneously and detecting which names are showing unusual activity, without having to check each one individually.
A live feed that surfaces the latest signal movements across 50,000+ instruments is a fundamentally different tool from a charting system where you query one company at a time. The difference is pull versus push. A charting system gives you answers when you ask questions. A live feed shows you what is happening before you know to ask.
For an analyst covering 50 names, a live feed can reduce the time spent on routine monitoring from hours to minutes. Instead of checking each name's search trends, sentiment, and social data manually, the live feed surfaces the names that are showing something unusual. The analyst then decides which to investigate.
For a systematic strategy, the live feed is a signal generation layer: a continuous stream of data points that can be fed into models or screeners to surface opportunities in near real-time.
The Paradox Live Feed
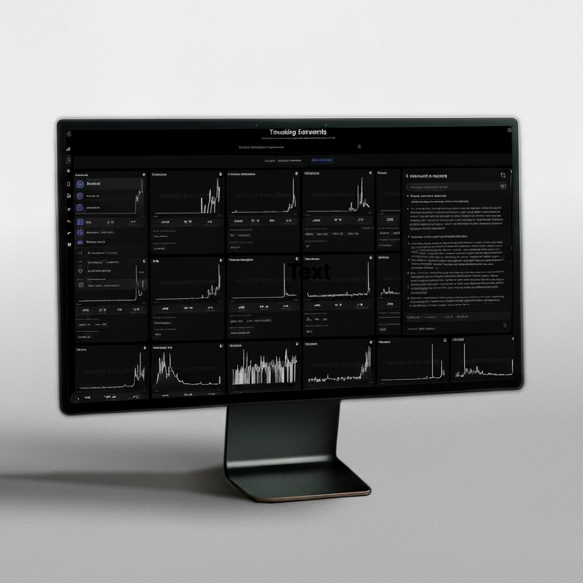
The Paradox Live Feed provides a real-time, sortable table of the latest alternative data signal movements across all tracked instruments and data sources. Key features:
- Multi-source signal display: Each row shows the latest signal readings across Google Search, YouTube, Amazon, TikTok, Reddit, Wikipedia, News Sentiment, News Volume, Web Traffic, App Downloads, and other sources simultaneously — for a single instrument at a glance.
- Sortable by signal type and magnitude: Sort by the source that matters most for your analysis, or by overall signal strength. Filter to specific sectors, geographies, or asset classes.
- Real-time updates: The feed refreshes continuously as new signal data arrives, without requiring a manual refresh.
- Drill-down to Analyze: Click through from any live feed row to the full analytics view for that instrument, where you can see the complete signal history, source breakdown, and historical context.
The live feed is designed to be the starting point for a session: scan what has moved, identify what warrants deeper work, and move to the relevant tools for further analysis.
Event-driven workflows
Real-time monitoring is particularly valuable around events, where speed matters and the window for acting on information is short.
Earnings season: In the 24–48 hours before a major earnings print, a live feed showing accelerating or decelerating search, social, or sentiment signals for the reporting company provides an updated read on expectations. After the print, seeing how signals respond — whether demand trends confirm or contradict management guidance — is useful for assessing the quality of the result.
Product launches: When a company announces a new product, the speed of organic search and social uptake is visible in real-time data within hours of the announcement. An organic surge in search and app activity is a different read from a flat response despite heavy media coverage.
Macro events: After a central bank decision, geopolitical development, or major economic release, a live feed showing which sectors and names are showing signal responses allows rapid identification of the most affected instruments — before price action has fully reflected the impact.
Short-squeeze and sentiment events: Rapid social engagement spikes around individual names (Reddit threads, TikTok virality) are visible in real-time sentiment and social data before they manifest in trading volume or price.
Building real-time into your process
The most common failure mode for real-time data is treating it like scheduled data: checking it once a day at the same time and ignoring it otherwise. That defeats the purpose. A few principles for integrating real-time monitoring effectively:
Use it for intraday triage, not position management. Real-time signals are best used to identify what warrants attention today, not to make position-level decisions on their own. Separate the surveillance function (live feed, global view) from the analysis function (deep dive per name) from the decision function (fundamental and valuation work).
Set a structured response protocol. When the live feed shows an unusual movement, define in advance what you do next: alert the portfolio manager, add to a review queue, immediately pull the signal history for context. Without a protocol, real-time data creates urgency without clarity.
Filter by your universe. Not everything in a 50,000-instrument universe is relevant to every strategy. Filter the live feed to your coverage universe or sector focus to reduce noise and keep the signal-to-attention ratio high.
For more on building a real-time monitoring workflow, see Watchlist Strategy, Nervous System, and Research.
This post is for institutional investors and research professionals. It is not investment advice.