

Prediction markets are efficient -- but not perfectly efficient. Their prices reflect the aggregated beliefs of financially motivated participants, which is a meaningful signal. But those participants are working with incomplete information. Most of them are reading the same news, watching the same price action, and forming views from the same public sources.
Alternative data gives you a different layer of information: what consumers are actually searching for, what social platforms are amplifying, how brand sentiment is moving, what web traffic patterns are doing. When that behavioral evidence diverges from what a prediction market is pricing, there is often a mispricing worth investigating.
This is not about finding an exploit. It is about having a more complete information set than the average participant in the market. That is what alternative data does for equity investing -- and the same logic applies to prediction markets.
The core idea: behavior leads belief
Prediction market prices reflect what participants believe will happen. Alternative data reflects what is already happening at a behavioral level. The gap between those two -- belief and behavior -- is where the signal lives.
A few examples of how this plays out:
-
A Polymarket contract on whether a consumer brand will beat quarterly revenue estimates is pricing a 55% probability of a beat. Your search and app data shows branded search accelerating and app engagement rising sharply in the last six weeks. Behavioral evidence is pointing to a stronger quarter than the market is pricing.
-
A contract on whether a political candidate will win a primary is at 40%. Social data shows their content going viral on TikTok and Reddit engagement spiking well above baseline across key demographics. The crowd has not yet updated.
-
A macro contract on whether a specific economic indicator will come in above consensus is at 50%. News sentiment around the underlying topic has been consistently positive for three weeks, while the contract price has barely moved.
In each case, alternative data provides evidence that the behavioral reality is ahead of what the prediction market is pricing.
Which alternative data signals map to which contract types
Not all alternative data is relevant to every prediction market. The key is matching the right signal to the right outcome.
Consumer and retail contracts
Polymarket runs markets on retail sales data, consumer confidence, and company-specific revenue outcomes. The most relevant alternative data signals for these are:
- Amazon and Google search volume for specific brands or product categories. Rising branded search in the weeks before a quarter closes is one of the strongest leading indicators of consumer demand that is available publicly.
- Web and app traffic for digitally-native brands. Traffic trends in the final weeks of a quarter closely track the revenue that will be reported.
- Social engagement on TikTok and Reddit for consumer brands. A product going viral on TikTok in Q1 is likely to show in consumer demand data for Q1.
Macro and policy contracts
Markets on Fed decisions, inflation prints, employment data, and policy outcomes. Relevant signals:
- News sentiment volume and tone around the underlying topic. A sustained increase in negative sentiment around inflation, for example, tracked over weeks, often precedes a hawkish data print.
- Google Search trends for economically sensitive terms: mortgage rates, layoffs, job search, specific policy keywords. Search behavior is one of the earliest publicly visible indicators of shifting consumer economic experience.
- Wikipedia page views for policy-relevant topics. Spikes in Wikipedia traffic for topics like "Federal Reserve" or "interest rates" often precede market-moving events by days.
Company-specific outcome contracts
Markets on earnings beats, executive departures, regulatory decisions, or product launches. Relevant signals:
- Multi-source search data (Google, Amazon, YouTube) to track demand or awareness for the company's core products in the relevant period.
- App intelligence data for companies with significant mobile presence -- download trends and DAU changes in the weeks before an earnings event.
- News and text sentiment to detect narrative shifts that are not yet priced into either the equity or the prediction market.
Political and event contracts
Markets on election outcomes, geopolitical events, regulatory decisions. The most relevant signals:
- Google Search trends for candidate names, party names, or policy keywords by region. Search volume is a leading indicator of voter engagement and enthusiasm that polls often miss.
- Social volume and sentiment on Reddit and TikTok for political topics and candidate content. Organic social amplification, particularly when it is growing faster than news coverage, is often an early signal of shifting momentum.
- News sentiment divergence -- when news coverage is uniformly negative about a candidate but prediction market odds are holding steady, one of the two is wrong. Alternative data can help identify which.
A practical framework for using alt data on prediction markets
Step 1: Identify the behavioral driver of the outcome
For any prediction market contract, ask: what is the underlying behavioral or economic variable that will determine this outcome? A retail sales contract is ultimately driven by consumer demand. A company earnings contract is driven by product demand and execution. A political contract is driven by voter behavior and engagement. That variable is what you want to measure with alternative data.
Step 2: Find the right signal and time window
Match the contract to the relevant data source and look at the right time window. For a quarterly earnings contract, the relevant window is the quarter being reported, particularly the final four to six weeks when demand is most concentrated. For a macro data release, look at the four weeks preceding the reference period end date.
Step 3: Compare the behavioral evidence to the contract price
If your alternative data is pointing consistently in one direction and the contract price has not moved to reflect it, you have a candidate mispricing. The strength of the signal increases when multiple data sources agree: search, social, and web traffic all pointing the same direction is stronger than any single source alone.
Step 4: Check for information that would explain the gap
Before concluding you have found a mispricing, check whether there is obvious news or market information that would explain why the contract price diverges from your behavioral data. Sometimes the market knows something that behavioral data does not capture: a private guidance update, a regulatory development, a known methodology change in the underlying data series. Rule out known explanations before acting on the divergence.
Step 5: Size the position relative to your confidence and the market's liquidity
Prediction market positions are only as reliable as the market's liquidity. Liquid markets on high-interest events -- Fed decisions, major earnings, well-followed elections -- are more responsive and more reliable than thin markets on niche topics. Weight your position accordingly.
Where Polymarket-specific alternative data fits in
The ICE-Polymarket Signals and Sentiment product, launched in February 2026, packages Polymarket's on-chain data and maps it to securities and sectors via ICE's entity databases. This is useful for understanding what prediction markets are pricing across a broad set of contracts at scale.
But the edge in using prediction markets effectively is not in having access to the prediction market data itself -- it is in having better behavioral intelligence than the other participants in the market. That means search trends, app data, social signals, and news sentiment that the average Polymarket participant is not systematically tracking.
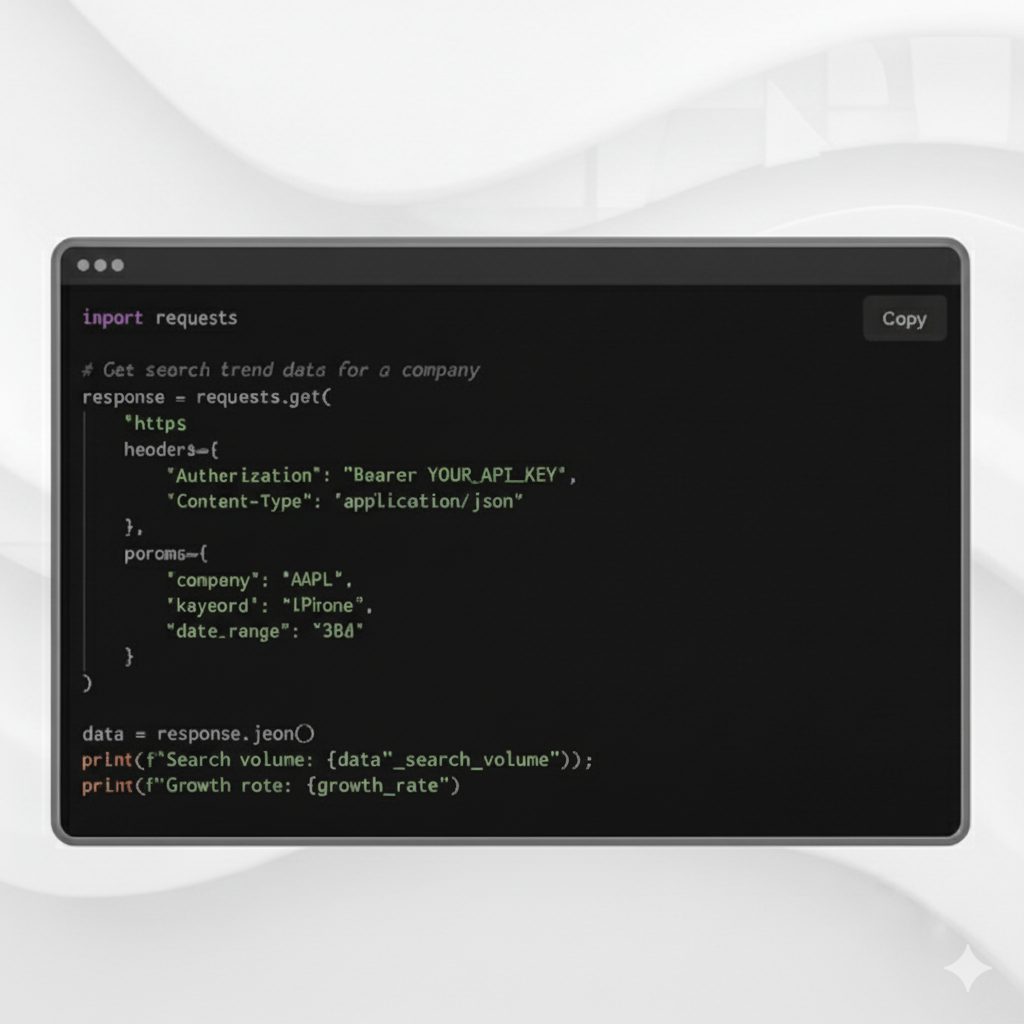
Paradox Intelligence provides the behavioral alternative data layer that complements prediction market analysis: Google search, Amazon search, YouTube, TikTok, Reddit, web traffic, Wikipedia, and news sentiment, all normalised and mapped to companies, sectors, and investable themes. For the full dataset catalog, see Datasets.
Related resources
- Prediction Markets for Investors: How to Use Polymarket Data and Alternative Data Together
- 5 Alternative Data Sources Hedge Funds Use Most
- Amazon Search Intelligence for Investors
- App Intelligence Data for Investors
- Hedge Fund Intelligence: How Leading Funds Use Alternative Data
- Find Your Plan
This post is for institutional investors and research professionals. It is not investment advice.